Analyzing WebAssembly binaries - Wasm Reverse Engineering
0 minutos de leitura
John Bergbom
We recently published a blog post on security issues and fundamental concepts of WebAssembly (Wasm). As a follow-up, this post will give an introduction to reverse engineering of Wasm applications. Think about a scenario where you come across an unknown Wasm application and you need to figure out what it does. How would you go about analyzing it? There is hardly any useful documentation on the subject available at present, so we’ve decided to partly fill that void.
A Wasm application can be analyzed in different ways. Today we will introduce the Wasm debugging capabilities built-in to Chrome by looking at a very simplistic application. Some theory will be introduced as we go along.
An impatient reader wanting to get straight to the more technical stuff can grab the HTML file test.html from the Appendix section, and then jump directly to the section ‘Debugging our Sample Application’.
Why analyzing Wasm?
Why are we interested in analyzing Wasm applications in the first place? Let’s answer that question before delving into hands-on technicalities.
At Forcepoint we’re interested in how malicious actors take advantage of emerging techniques and technologies. Whenever a new threat emerges, such as a new ransomware family, an IoT worm, or something more unusual, security researchers want to analyze the functioning of that malicious piece of code. When we know how a malicious piece of software works, and we are aware of its properties, we can write signatures to get protection in place.
Many tools exist for analyzing traditional malicious software, whether it be obfuscated JavaScript, a malicious Flash object, a portable executable (PE), or something else. A well-established methodology exists for analyzing these kinds of threats.
As we touched upon in our first post in this series, the situation with Wasm is different. Hardly any documentation exists on how to analyze Wasm applications, and most common tools for reverse engineering do not understand Wasm yet. This blog post is an attempt to shed some light on reverse engineering a Wasm binary.
Creating a sample ‘Hello World’ Wasm application
Let’s start by creating a simple Wasm application that we will analyze later on. We will run the application inside a browser and use Chrome’s Developer Tools to analyze it.
To run a Wasm application in a browser, we will need an HTML file to load and execute the Wasm binary. Let us go through the process of creating this HTML file. (As previously noted, we will eventually arrive at the file that is listed in the Appendix at the end of this post.)
Start with the following skeleton (that we will modify further) and save it as a file named test.html:
For an easy setup and to avoid having to install any tools, let’s use an online web application called WasmFiddler to generate our Wasm. In WasmFiddler, type in the following simplistic program:
void hello() {
  printf("Hello World\n");
}
Then click ‘Build’ as shown in the screenshot below:
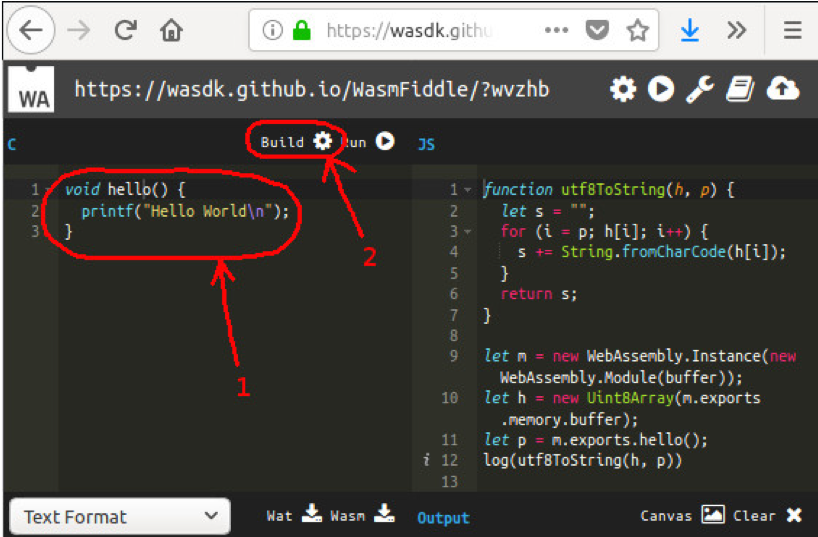
Figure 1: Compiling a Wasm application with WasmFiddler.
On the right in the above screen shot we see a function named utf8ToString(). Copy and paste that function into the JavaScript portion of our HTML page, placing it above the test() function.
Still looking on the right hand side in the screenshot, we can see a few rows of JavaScript after the function utf8ToString():
let m = new WebAssembly.Instance(new WebAssembly.Module(buffer));
let h = new Uint8Array(m.exports.memory.buffer);
let p = m.exports.hello();
Copy these rows and paste them into the test() function. Those rows will instantiate our Wasm from code that will be defined in an array named ‘buffer’, and then execute our hello() function.
So how do we actually define the content (Wasm code) of this buffer? In the WasmFiddler, click the drop-down menu below the source code (the one that says ‘Text Format’ in Figure 1), and select ‘Code Buffer’.
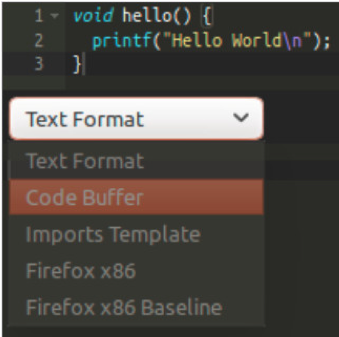
Figure 2: Viewing the Code Buffer in WasmFiddler.
WasmFiddler will now generate the binary Wasm code and put it into a JavaScript buffer. You should get this (shortened for brevity):
var wasmCode = new Uint8Array([0,97,115,109,1,0,0,0,...,108,100,0]);
Note: If you instead just get an empty array (“var wasmCode = new Uint8Array([null]);”), then you forgot to compile the source code first. In that case click Build and try again.
Copy this buffer and paste it into the beginning of our test() function. Rename the array from ‘wasmCode’ to ‘buffer’ to match the naming of the other code generated by WasmFiddler.
If you recall from our first blog post in this series, a Wasm application cannot print out text to the screen by itself. We need to define a JavaScript function that the printf() call in our Wasm code can use. In WasmFiddler, select Text Format in the drop-down menu to see a textual representation of our compiled Wasm application:
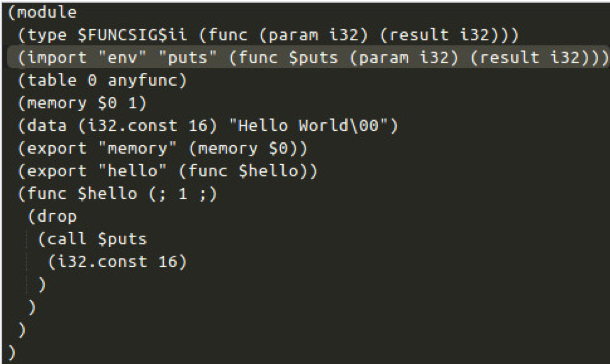
Figure 4: Imports template for the puts() function.
Copy the ‘wasmImports’ definition seen above and paste it into the beginning of our JavaScript test() function. Then we need to provide this imports definition to the instantiation of the Wasm. Do that by using the following instantiation:
var m = new WebAssembly.Instance(new WebAssembly.Module(buffer),wasmImports);
Finally, let’s define what the puts() function should do when called. Change it to the following:
puts: function puts (index) {
alert(utf8ToString(h, index));
}
Now we have gone through all necessary steps to build our demo program. Loading our file test.html in Chrome gives us an alert:
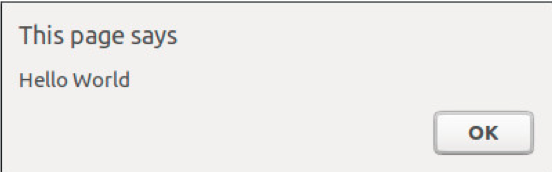
Figure 5: Alert in Chrome.
We can see that the Wasm code successfully called our external function.
Note: If you don’t see the popup, then the problem is likely that your browser does not support Wasm. In that case, please try with a more recent browser, as the most recent versions of all major browsers should support Wasm.
Debugging our sample application
Now we’re finally at the point where we can introduce debugging using Chrome Developer Tools.
With the test.html file open in Chrome, start Chrome Developer Tools (by pressing F12) and select the Sources tab at the top. Then press Ctrl+R to reload the page. Now a little cloud icon with the text ‘wasm’ appears. Expand it as well as the item below it. Select the leaf entry under the wasm sub-tree. You should now see something like this:
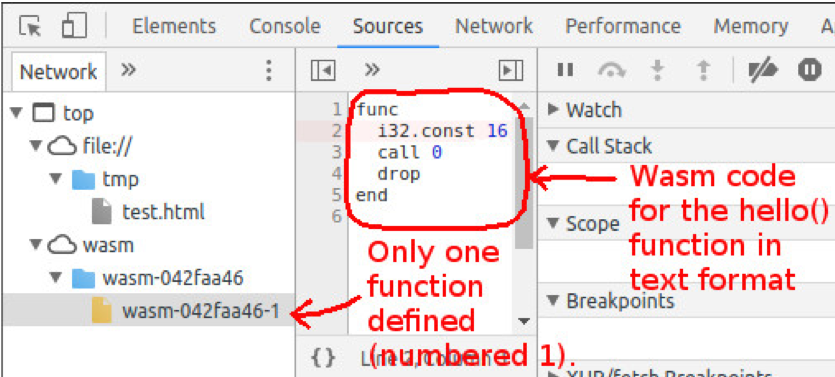
Figure 6: Chrome Developer Tools
Let’s single-step execution of this function in order to better understand what it does. Click on the left of the line starting with ‘i32’ to set a breakpoint. A blue bar will become visible, indicating that the breakpoint is set. Next, press Ctrl+R to reload the page again. Execution will now stop on the breakpoint. At this point the Wasm stack is empty. Now press the Step Over button (F10 or the icon with a bent arrow) in the debugger to execute the instruction ‘i32.const 16’, which will put the value of 16 on the stack:
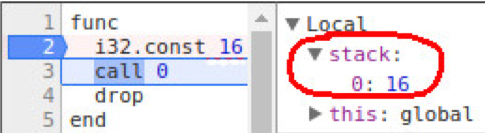
Figure 7: Value 16 put on the stack.
All functions in Wasm are numbered, and function number 0 corresponds to the function ‘puts’ that Wasm imports from JavaScript (and function number 1 is the ‘hello’ function). Therefore, the next instruction, call 0, corresponds to calling the printf/puts function, and the value ‘16’ on the stack is the argument.
How can the value ‘16’ correspond to the string ‘Hello World’? This value is actually a pointer to an address in the Wasm application’s memory space. Chrome’s debugger lets us view the memory of the Wasm application by expanding the Global tree:
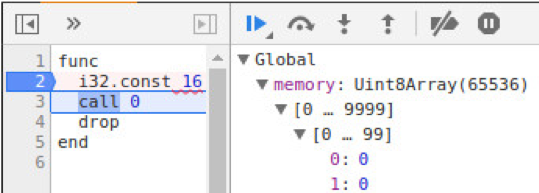
Figure 8: Peeking at the memory of the Wasm application.
Let’s peek at position 16 in memory:

Figure 9: ‘Hello World’ in memory of the Wasm application.
The memory space of a running Wasm application is actually implemented as a JavaScript array. This array is declared in the HTML file that’s responsible for loading the Wasm application. In our above example, the following row declares the variable ‘h’, containing the memory space of the application:
let h = new Uint8Array(m.exports.memory.buffer);
Now press the Step Over button once again to execute the call. That will finally give us the JavaScript alert.
Conclusion
We have now successfully reverse engineered our first simple Wasm program. The example was extremely simplistic, but we have to start with the basics.
In the process of reversing we learned how Wasm interacts with the outside environment by calling imported functions that are declared in JavaScript. Also, we learned how memory is shared between JavaScript and Wasm.
Forcepoint Security Labs will continue to monitor the evolution of WASM and provide updates as appropriate.
References
WasmFiddle, compile Wasm online: https://wasdk.github.io/WasmFiddle/?wvzhb
Video on how to debug Wasm in the browser’s debugger: https://www.youtube.com/watch?v=R1WtBkMeGds
Passing values between JavaScript and Wasm: https://hacks.mozilla.org/2017/07/memory-in-webassembly-and-why-its-safer-than-you-think/
Appendix: test.html
For ease of reference, here is the entire test.html file that we created and then analyzed:

John Bergbom
Leia mais artigos de John BergbomJohn Bergbom is a Senior Security Researcher on Forcepoint’s Special Investigations team within Forcepoint Security Labs. He investigates a range of topics ranging from malware analysis and reverse engineering to the security implications of new technologies. From previous roles, he has extensive experience with penetration testing (mostly infrastructure and web), binary analysis, development of proof-of-concept exploits, and software development (mostly in C, Python, and Java).
John brings deep understanding not only of common vulnerability classes but also how criminals exploit vulnerabilities. For example, John goes far beyond the simple knowledge that “SQL injection is bad” but understands exactly how a SQL-injection could be turned into a successful compromise. This allows him to guide the development of Forcepoint products, improving their protections for customers.
No Artigo
X-Labs
Receba insights, análises e notícias em sua caixa de entrada

Ao Ponto
Cibersegurança
Um podcast que cobre as últimas tendências e tópicos no mundo da cibersegurança
Ouça Agora